Finding Memory Leaks
Although not required for your code review, if you are curious how to find memory leaks in your code in Visual Studio (PC) or Visual Studio Code (Mac), this page outlines how to do so.
Visual Studio 2022 (PC)
Visual Studio has a built-in memory snapshot tool. The idea is you can take a snapshot at the very start of your main function and then a second snapshot as main is returning, and it will show the difference between the snapshots.
Here are the steps:
-
Open the Diagnostic Tools panel:

-
In the Diagnostic Tools window, from the Summary tab click on “Enable heap profiling (affects performance)”:
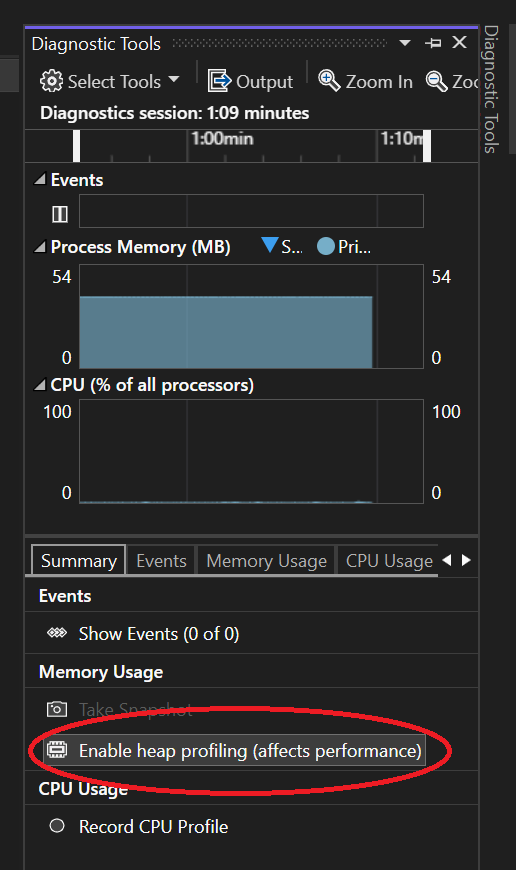 The UI may not appear to update, but only click the button once.
 -
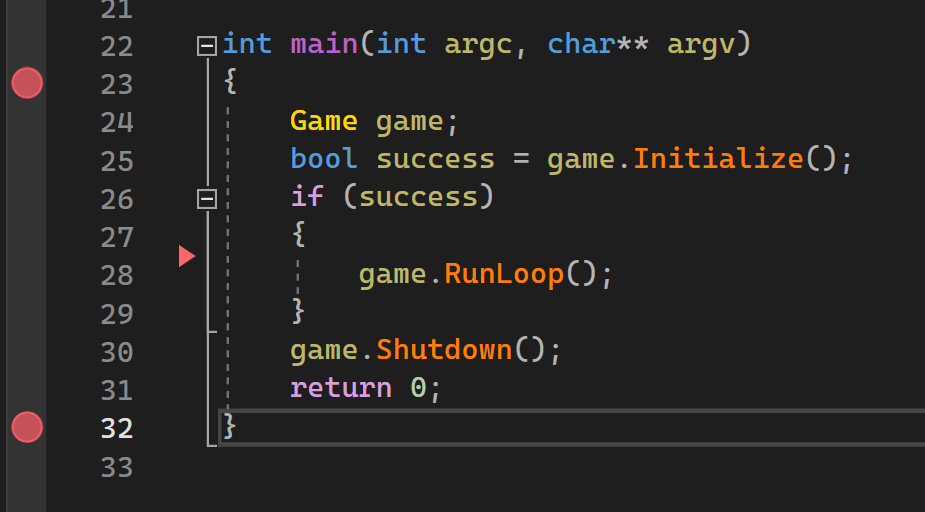
For the game you want to check for leaks, put a breakpoint on both the opening brace and closing brace of main, like this:
-
Now when you start debugging, the program will be paused at the breakpoint on the opening brace of
mainand you should see a warning message under the file tabs that Heap profiling is enabled:
-
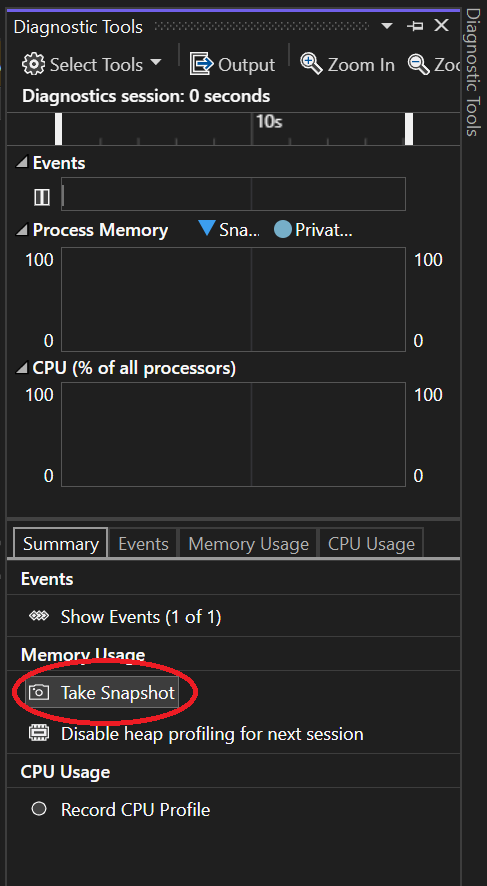
While still at the breakpoint, in the Diagnostics Tools window, click “Take Snapshot”:
-
Now click the “Continue” button to continue into the game. Once you close the window (or press ESC), you should be paused in the debugger at the ending brace of
main -
In the Diagnostic Tools window, once again click “Take Snapshot.”
-
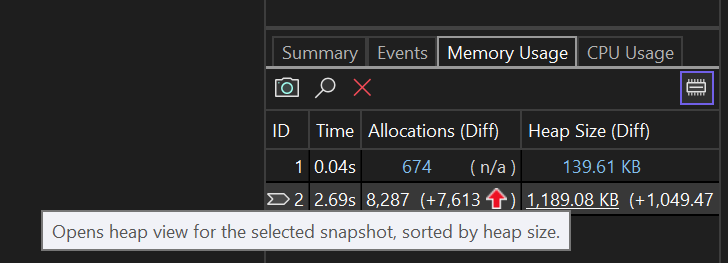
Still in Diagnostic Tools, under the “Memory Usage” panel click on the “Heap Size (Diff)” value for ID #2 (don’t be alarmed if you see some number here).
-
From the Types tab, it’s expected you will have a
char[]andchar*[]variable, as in this view: If that’s all you have, then that means you don’t have any memory leaks you caused!
 -
On the other hand, let’s say you aren’t actually deleting your components properly in the
Actordestructor. In this case, you might see something like:
-
From the “Stacks” tab you can find out where those were allocated by exploring for references to the
Lab02.exemodule and functions you wrote. If you click on the function you’ll see the types of objects it’s leaking, like this: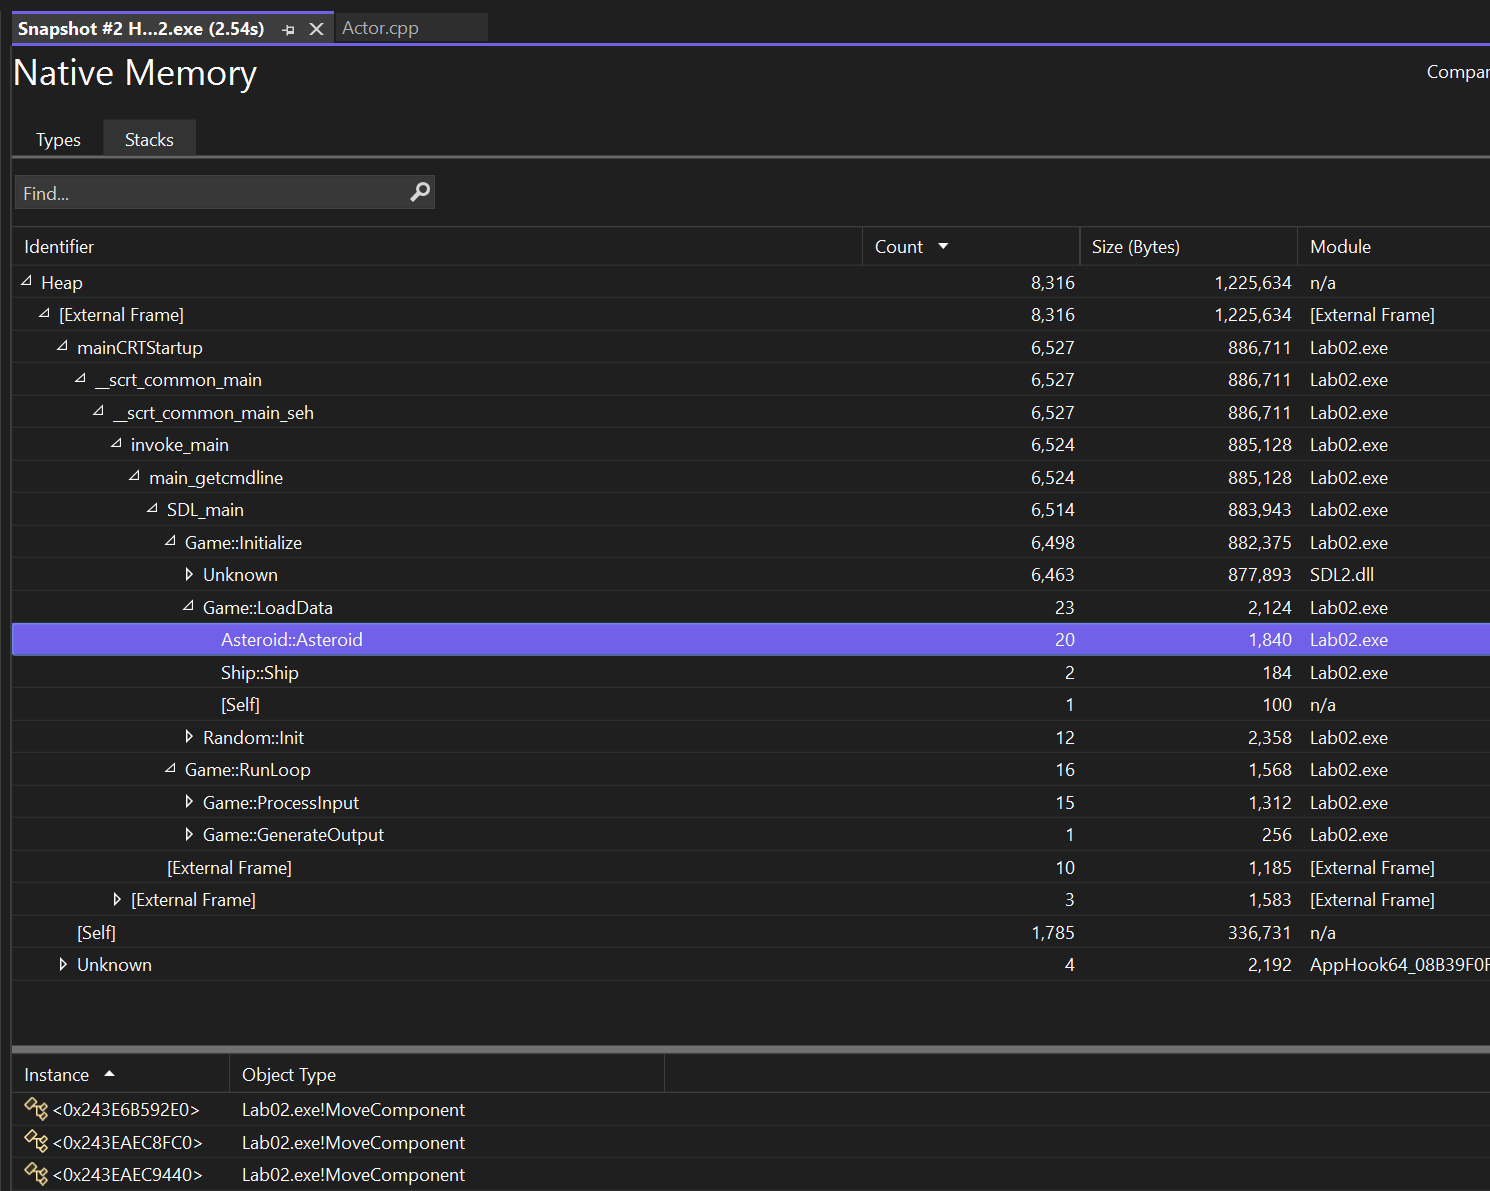
You will see a lot of stuff about memory for SDL2.dll, but you should ignore that. This is the main reason why the “Types” view is more helpful for finding leaks that you caused directly.
-
Once you are done, you should click “Disable heap profiling” on the Summary tab, as running with it always on will reduce your game’s performance.
Visual Studio Code (Mac)
There is no built-in way to find memory leaks in Visual Studio Code, but we can use a command-line tool that’s included on Mac that still will be helpful for finding the leaks.
-
In Visual Studio Code, compile the lab you want to check for leaks
-
In Terminal,
cdto your repo’s directory - From here
cdto thebuild/LabXXdirectory, whereLabXXis the lab you want to check. For example, if you are checkingLab02, you would do:cd build/Lab02 - Run the following command, replacing
Lab02with whichever lab you want to test:leaks -atExit -q -- ./Lab02This tells the built-in
leaksprogram that we want it to check for leaks when theLab02executable exits. - When you close your game window, it will take a couple of seconds to close as it checks for leaks. If there are no leaks, you should see it write out that there are 0 leaks, like:
leaks Report Version: 4.0, multi-line stacks
Process 67107: 23588 nodes malloced for 7552 KB
Process 67107: 0 leaks for 0 total leaked bytes.
You may see some warnings about malloc logging not working or that you can’t debug the target, but you can ignore these. The main thing is that it says there are 0 leaks.
- If there are memory leaks, then you will instead see a list of the leaks and the stack traces corresponding to their allocations, which will look like:
leaks Report Version: 4.0, multi-line stacks
Process 66995: 23583 nodes malloced for 7568 KB
Process 66995: 1 leak for 20480 total leaked bytes.

STACK OF 1 INSTANCE OF 'ROOT LEAK: <malloc in Game::Initialize()>':
4   dyld                                  0x1a9547e50 start + 2544
3   Lab02                                 0x1041325f0 main + 72  Main.cpp:25
2   Lab02                                 0x104125d88 Game::Initialize() + 40  Game.cpp:28
1   Lab02                                 0x104125ba0 operator new[](unsigned long) + 32  Core.cpp:16
0   libsystem_malloc.dylib                0x1a96dac20 _malloc_zone_malloc_instrumented_or_legacy + 128
====
    1 (20.0K) ROOT LEAK: <malloc in Game::Initialize() 0x13a80e800> [20480]