Debugging
Your code doesn’t work as you expect it to. Now what?
To debug properly, you need to systematically compare your expectations of what SHOULD happen to what ACTUALLY happens. You should validate each expectation one by one to narrow down exactly where it’s going wrong.
As an example, suppose your ship doesn’t appear to be moving. Here’s an example of how you might go through the process of debugging:
- “I expect that
MoveComponent::Updateis called once per frame.” Is it? Put a breakpoint at the start of the function. If it’s not getting hit, then that means it’s not being called. - “I expect the code in
MoveComponent::Updateupdates the position of the actor”. Is it? Use variable watches and step through the code. What’s the actor’s position before your code runs? What about after the code runs? Do the values before/after seem sensible and reasonable? (As an aside, using temporary variables may help with debugging as it’s easier to see the values in the debugger). - If you got through step 2 and it seems reasonable but still doesn’t work, then the next expectation might be “I expect only
MoveComponent::Updateis changing the actor’s position.” One way to validate this assumption is to continue past the breakpoint to the next time the function gets hit. Did the change you made persist, or did it reset to a different value? If it reset to a different value, and you’re not sure where it might’ve changed, you can us a conditional breakpoint (see below).
When posting on Piazza or asking questions in office hours, the more debugging legwork you do beforehand, the more we can help you. If you just say “it doesn’t work” and that’s it, we will ask you to do some debugging before helping. Please read the office hours expectations for more information.
Using the CLion Debugger
Using your development environment’s debugger is an extremely important programming skill as it allows you to trace through your code to figure out where it’s going wrong. Although different IDEs have slightly different user interfaces, the overall process of debugging and most terminology is similar.
Running in Debug Mode
To be able to use any debugging features, you need to run in debug mode. This is done by clicking the “bug” button on the top toolbar (instead of the play button):

As a general rule, you should always run using the bug button. In this class, there’s no reason to run with just the play button.
Setting Breakpoints
A breakpoint allows you to pause the execution of the program at a specific line. Note that it pauses before the line runs.
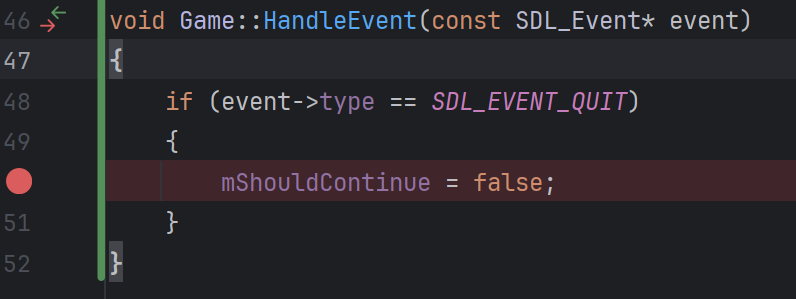
The easiest way to set a breakpoint is to mouse over the line number where you want the breakpoint and click, which will create a red circle that looks like this:
Keep in mind that you can add and remove breakpoints even while the program is running in debug mode! You will do this often when you want to get the game to a specific state before putting a breakpoint.
Now, if you click the bug button to run and reach the line of code, the debugger will pause at the line. When paused in the debugger, the line you are paused on will be highlighted:
While you can put breakpoints on empty lines or comments, it just means the debugger will pause on the next line of code that actually does something. In general, this doesn’t make sense to do, so you’re better off putting the breakpoint on real lines of code.
Inspecting Variables
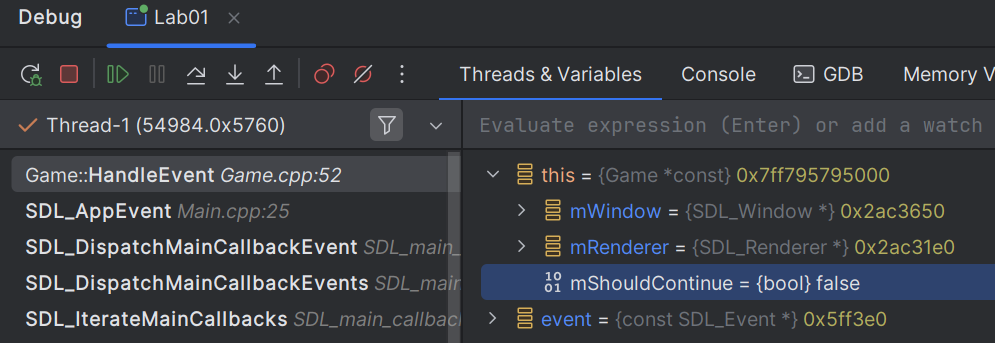
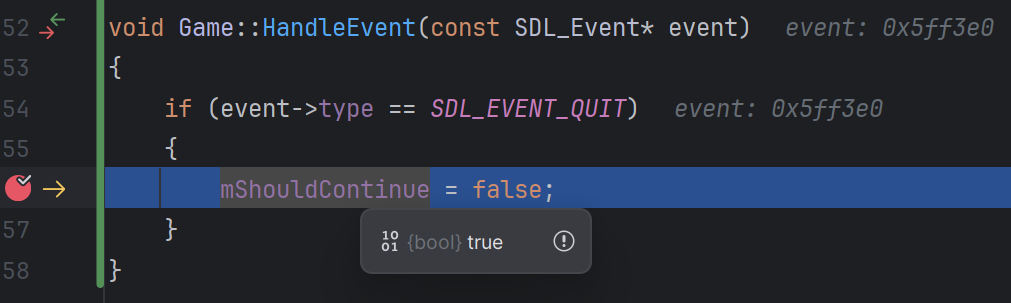
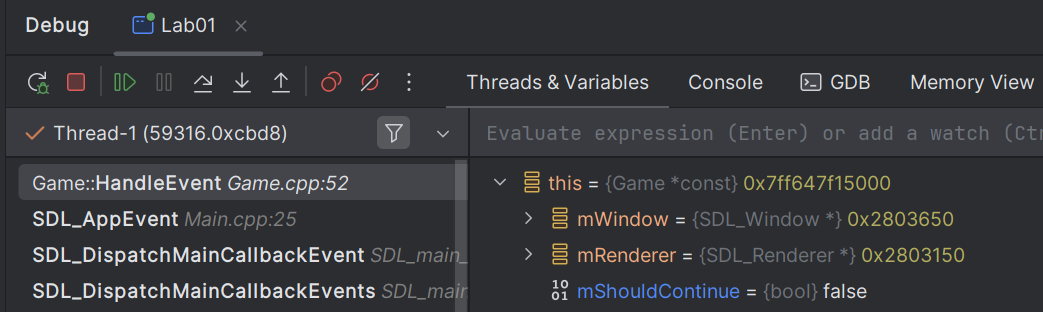
When paused in the debugger, the bottom pane in CLion will show you the call stack on the left (which says which functions are running), and will show you the values of variables in the rest of the view. You can expand variables by clicking the arrows next to them. In this screenshot, I clicked the arrow next to this to see what’s in the Game object:
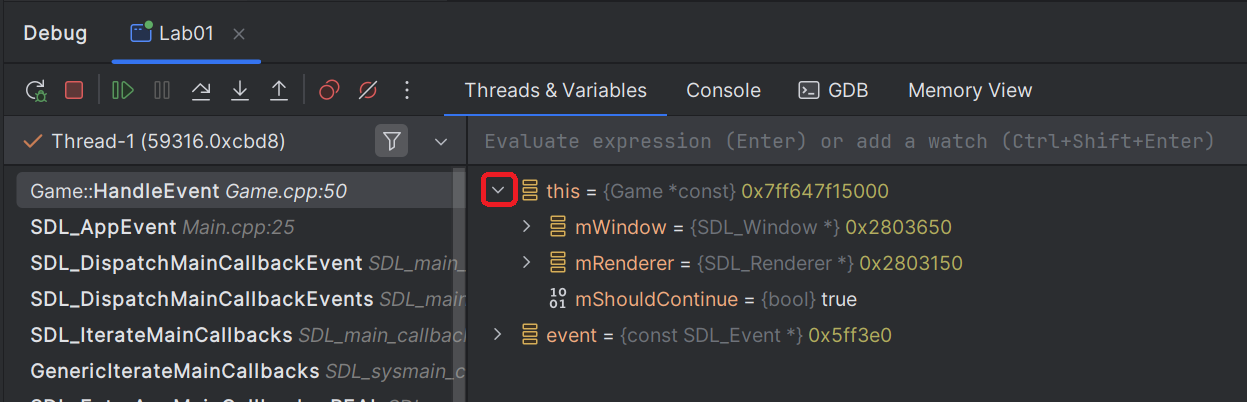
Notice that mShouldContinue shows that its value is true even though the line I’m paused on sets it to false! This is because when we pause on a line, it’s before the line is run.
As a shortcut, you can also mouse over variables that are in the current function to view their current values:
The Call Stack
When paused in the debugger, the call stack shows which functions are currently active. Remember that every time a new function is called, it gets pushed onto the top of the call stack. Similarly, when a function returns, it gets popped off.
You can use this to understand where a function is being called from. Take, for example, this call stack:
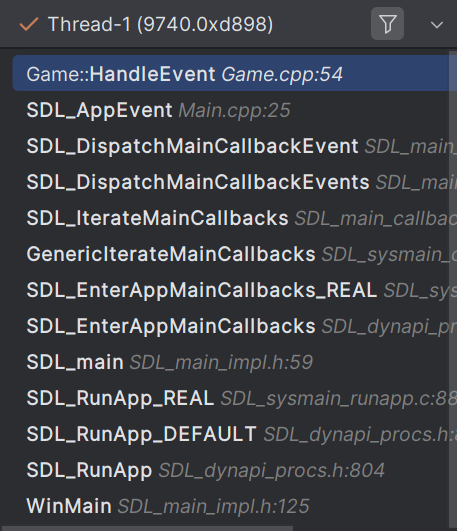
The top (and currently active) function or stack frame is Game::HandleEvent, and we’re paused on line 54 of Game.cpp. We can see that HandleEvent was called by the SDL_AppEvent in Main.cpp on line 25. This in turn was called by an internal SDL function and so on, until we get all the way down to WinMain, which is the main entry point for Windows programs.
In most cases, you are going to ignore internal SDL (and other) functions and just focus on the functions that you wrote.
In the call stack view, you can click on any function in the list to see what’s on that specific line of code, and the state of that function, as well.
Controlling Execution
Step Over
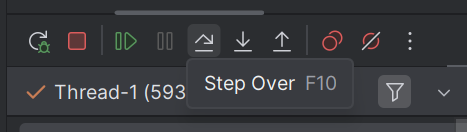
The debug pane also contains several buttons that control execution. The “Step Over” button looks like an arrow hopping over something and will complete execution of all code on the current line (including any functions) and continue to the next line.
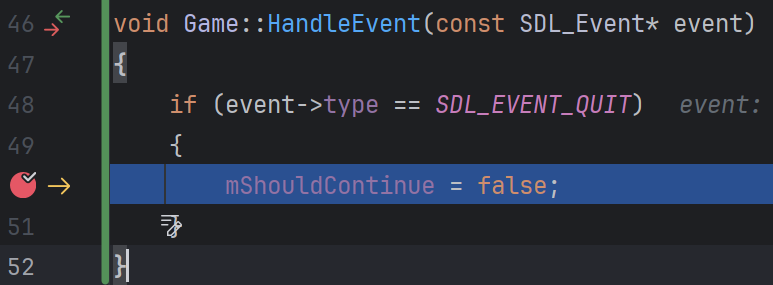
In this example, if you click the “Step Over” button, the execution will continue to the next line of code with something to do. In this case, that’s the closing brace of the function:
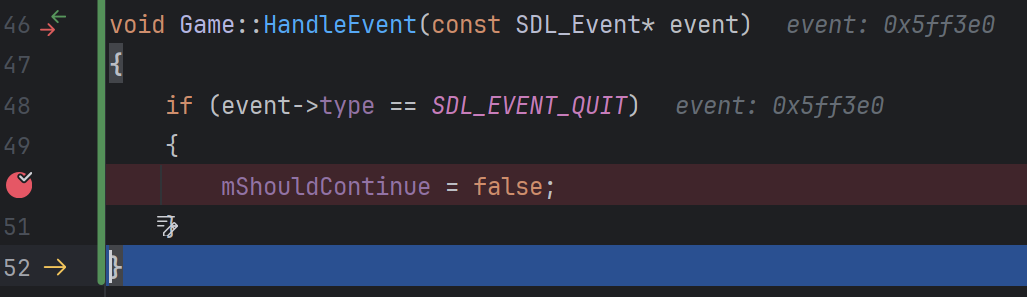
You’ll also notice that the debug pane highlights the text of any variables which have changed:
Step Into
If you are paused at a line which calls a function, the “Step Over” button will complete execution of everything on that line, including the function call, before pausing again.
However, sometimes you want to actually go into the function, in which case you can use “Step Into,” which is the arrow pointing straight down:
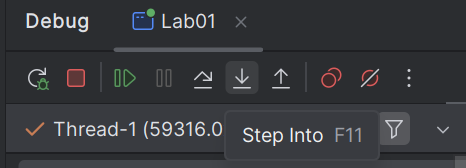
If the line you’re paused at doesn’t have any function calls on it, “Step Into” will do the same thing as “Step Over.”
Step Out
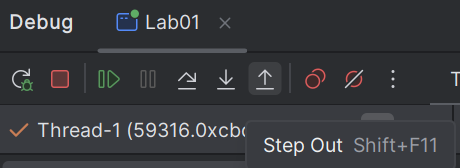
Sometimes, you may step into a function that you actually don’t want to try to debug, such as an SDL function. In this case, you can “Step Out” of the function which will finish the execution of the function and pause after it returns. The “Step Out” button is the arrow pointing straight up:
Resume Program
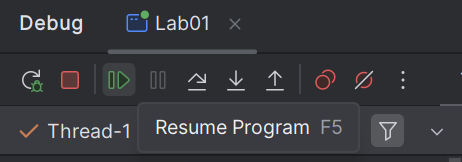
The “Resume Program” button tells the debugger to continue running in debug mode as normal. It will pause the next time a breakpoint gets hit, but otherwise will just keep running.
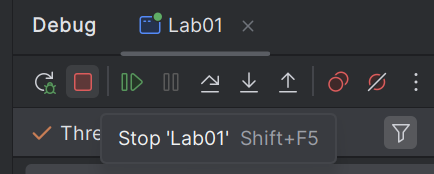
Stop
The “Stop” button will end the debugging session by immediately closing the program.
Viewing, Muting, and Removing Breakpoints
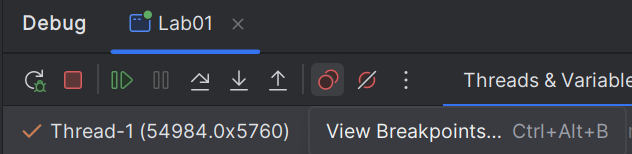
If you’ve placed lots of breakpoints and want to view them, you can click the “View Breakpoints” button on the toolbar, which is two red circles:
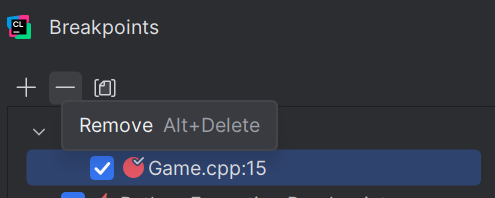
In this window, you can click on an individual breakpoint (or a category of breakpoints) and use the minus button to remove them:
You can also remove breakpoints in the source code view by just clicking on the red circle for the breakpoint you want to remove.
Sometimes, you may want to keep the breakpoints where they are but “mute” them so none of them get hit. In this case, you can click the red circle with a slash through it to temporarily mute them:
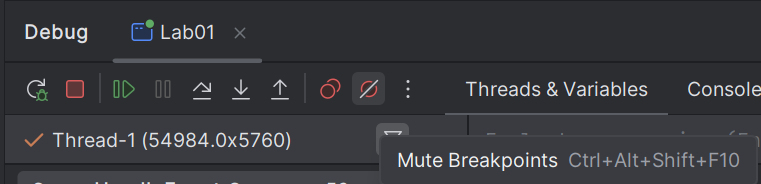
Clicking the button again will turn them back on.
Debugging Crashes and Traversing the Call Stack
If the game crashes while in debug mode, the debugger will pause on the line of code that crashes. You’ll notice that the debug pane will show the error code (in this case, it’s a segmentation fault, which likely means a bad memory access):
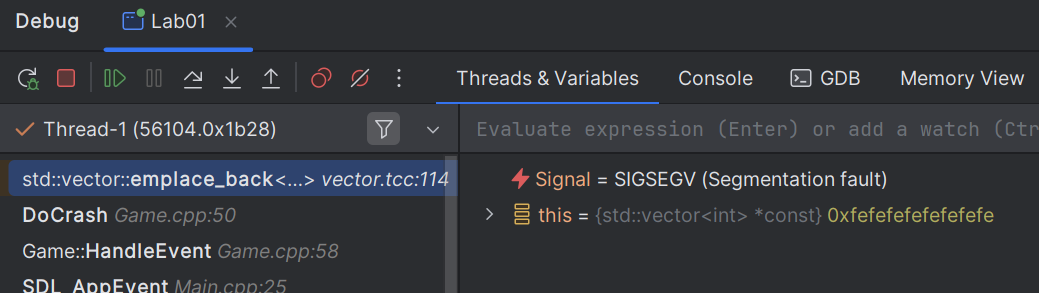
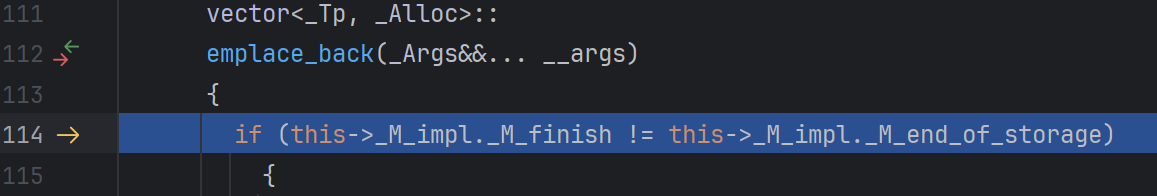
In this case, the code crashed in std::vector, and if you look at the lines of code it will be a lot of code that you didn’t write and don’t understand:
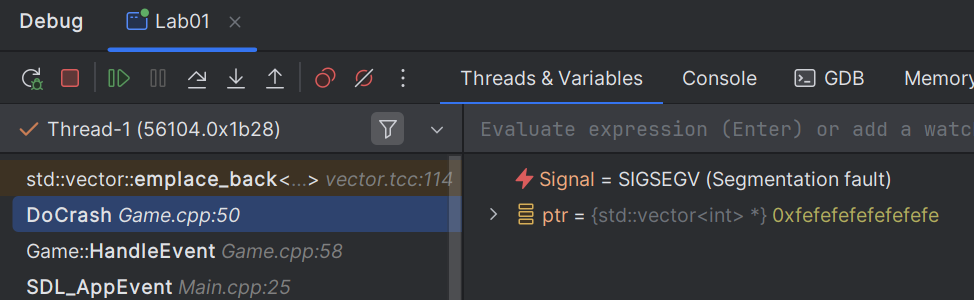
While it’s tempting to throw your hands up and say you don’t understand why it’s crashing, the key thing to take advantage of is the call stack on the left of the debug pane. Go down the list of functions and find the first function that you wrote, and click on it.
In this case, I’d click on the appropriately-named DoCrash function I wrote:
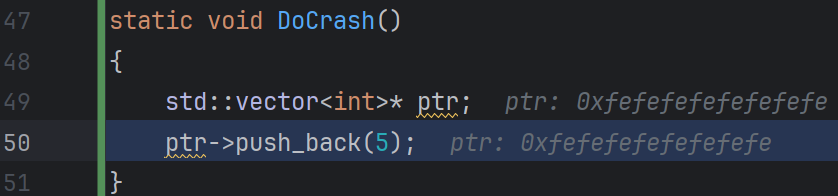
Inspecting the lines of code, I’d see that I “accidentally” have an uninitialized vector pointer, and that’s the true cause of the crash:
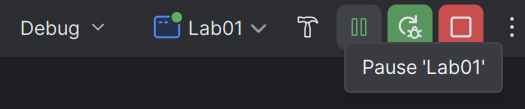
Debugging Infinite Loops
If you introduce an infinite loop, your game will freeze and be entirely unresponsive. To debug this, press the pause button on the top toolbar (or in the debug pane):
Then you can inspect the line of code and/or traverse the call stack to figure out where the infinite loop is coming from:
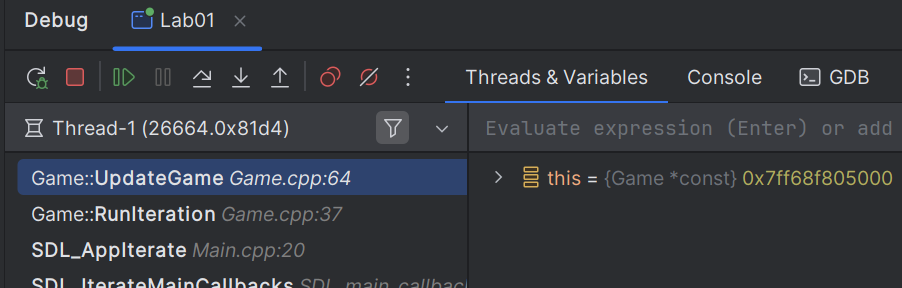
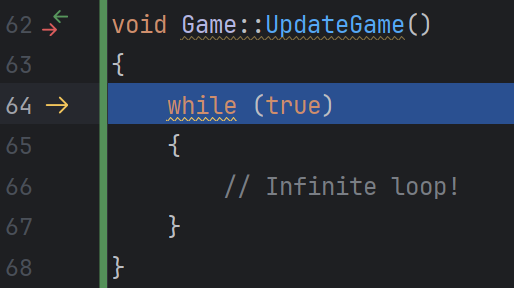
In the above case, we can see that Game::UpdateGame is somehow involved in the infinite loop. And if we look at the line we can see it:
Debugging Stack Overflows
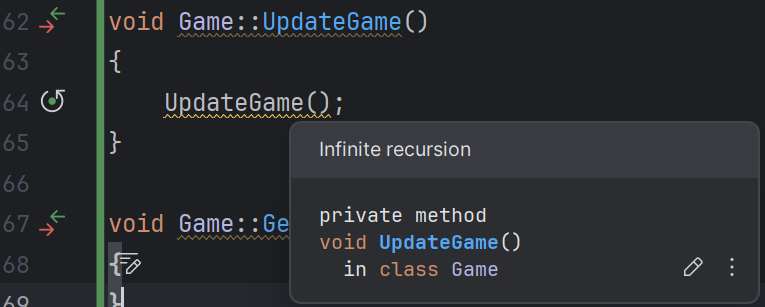
In most cases, you’ll only get a stack overflow if you have infinite recursion. We won’t really use recursion in this class (with maybe one exception), but if you get a stack overflow, the program will crash in the debugger and the hallmark is that the call stack will show lots of entries of the same function at the top:
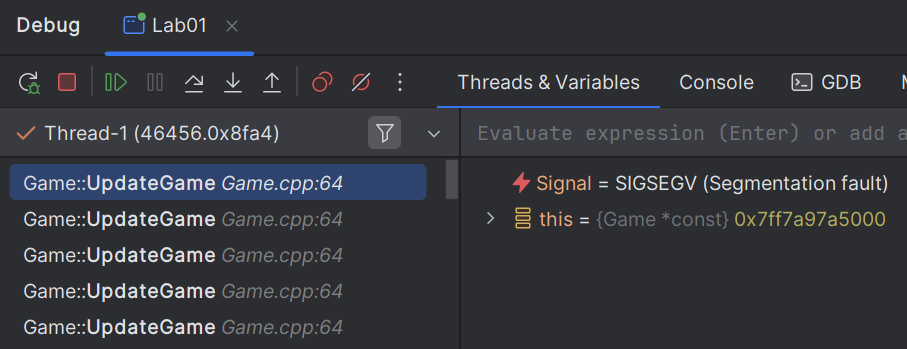
In the above case, we can see that the UpdateGame function appears to the the culprit. If we view the code in question, we can clearly see there’s infinite recursion, and in this case, the IDE even helpfully warns us:
Data Breakpoints
Data breakpoints are a slightly more advanced debugging feature, but they are extremely powerful.
Let’s say my mShouldContinue variable in Game is mysteriously changing, and I’m not really sure why. A data breakpoint tells the debugger to pause when a specific variable changes.
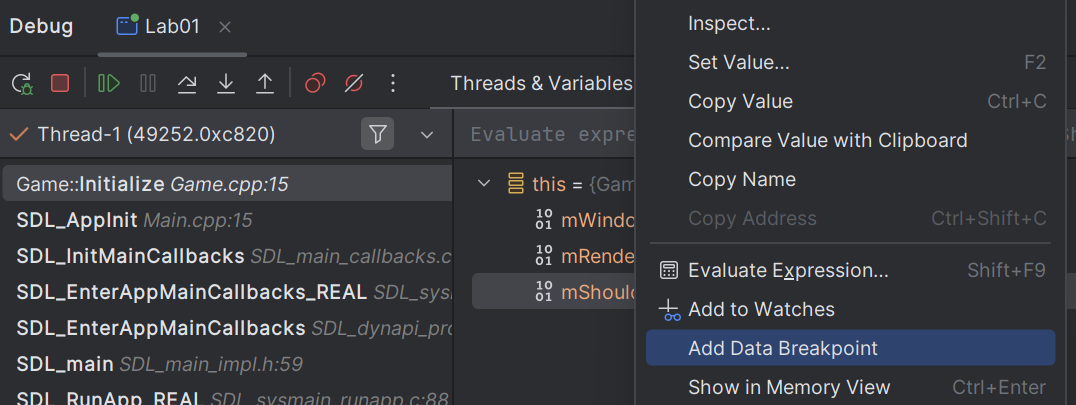
To setup a data breakpoint, you should first put a breakpoint somewhere where the variable you want to watch is in scope. For this example, you could put a breakpoint in Game::Initialize since you know mShouldContinue would be in scope there.
Then, when you hit the breakpoint, in the debug pane, right click on the variable in question and select “Add Data Breakpoint”:
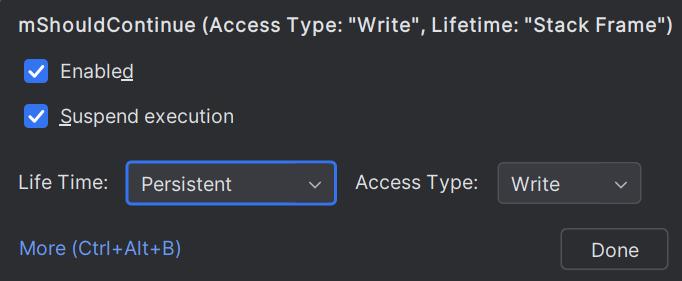
This will bring up a small box. In this box, make sure you change the “Life Time” to “Persistent” and then click “Done”:
Now you can “Resume Program” and when the variable changes, the debugger will pause where it happened, highlighting the variable: